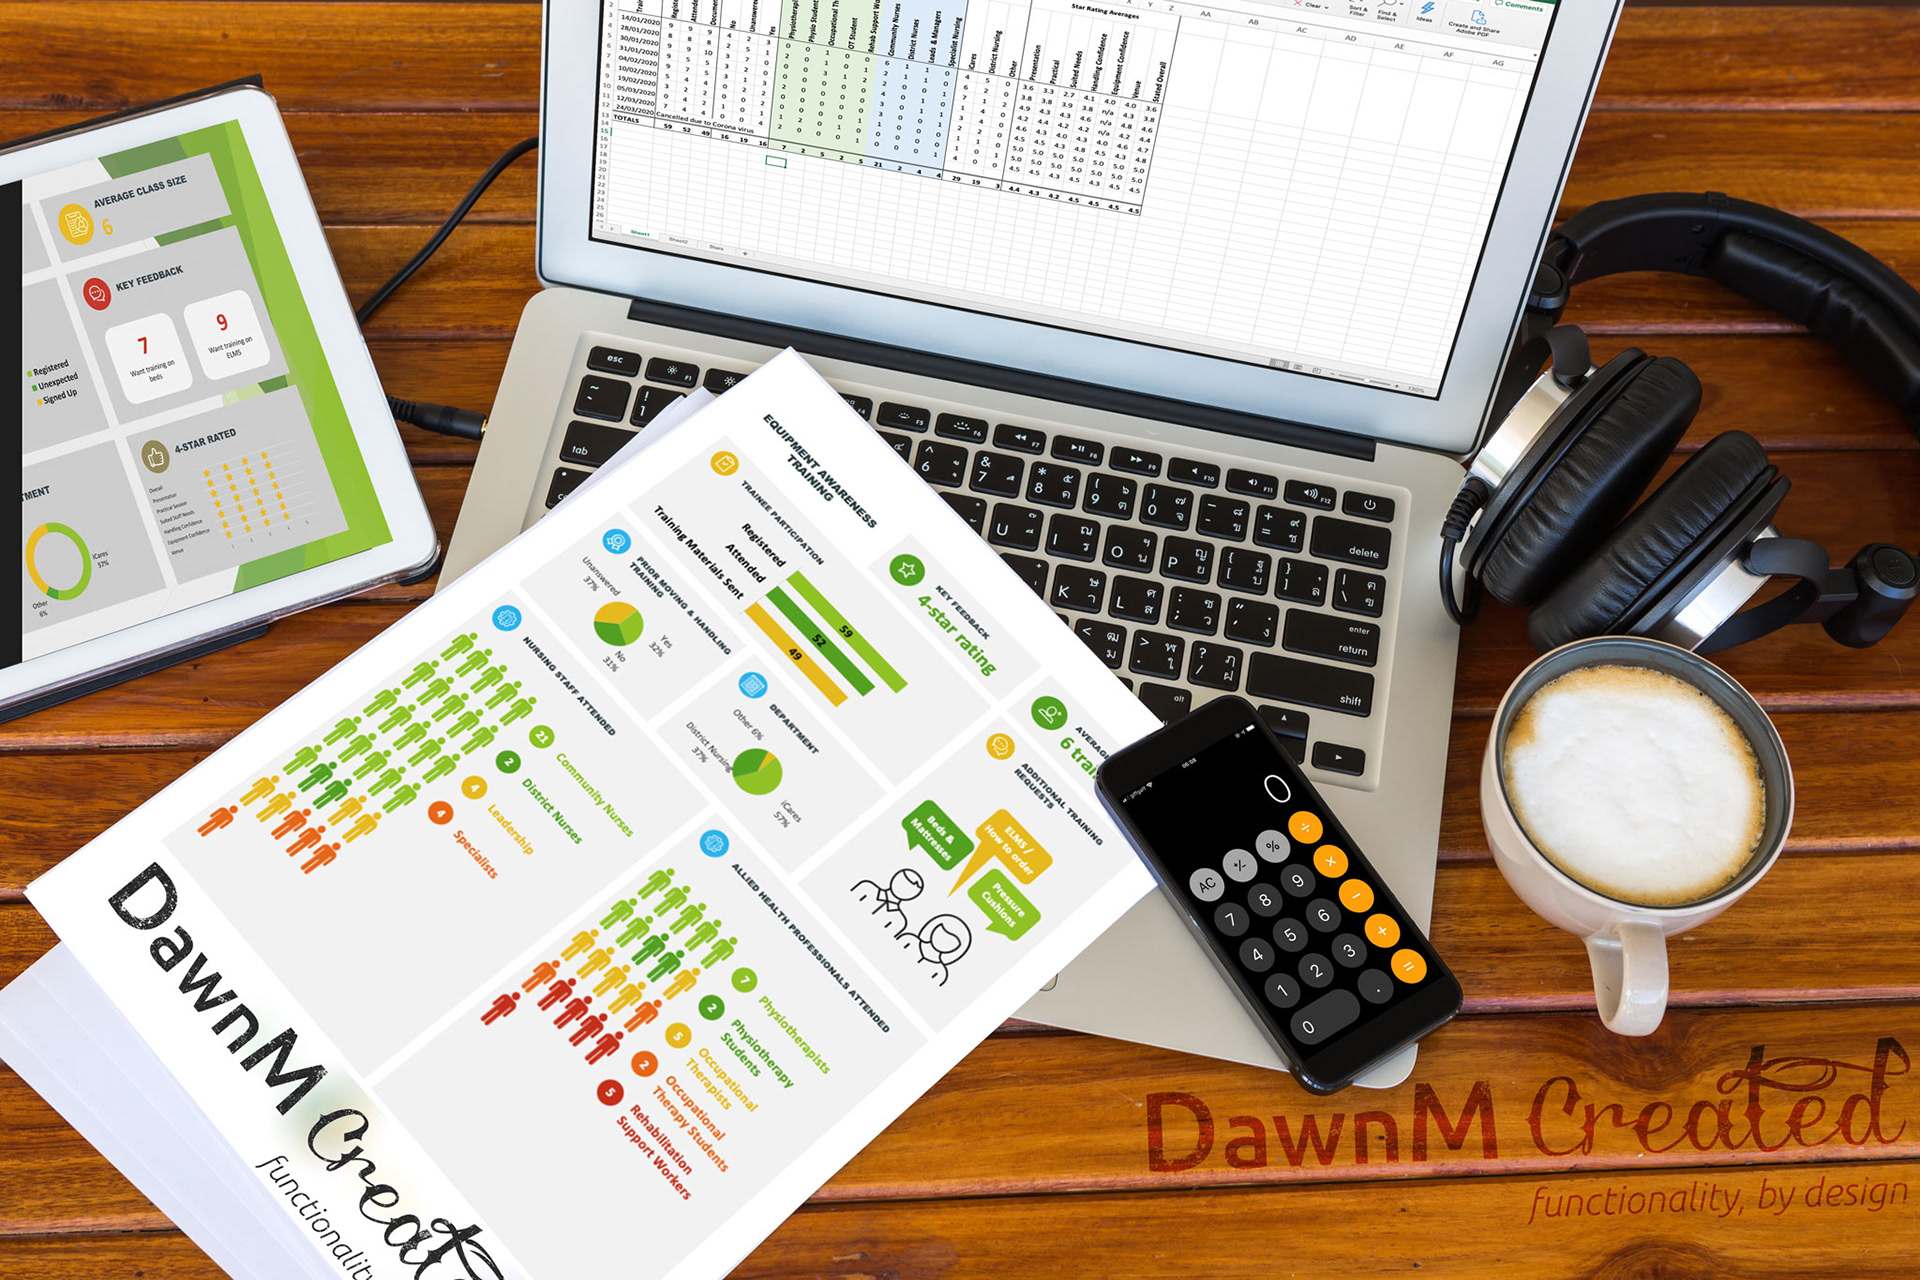
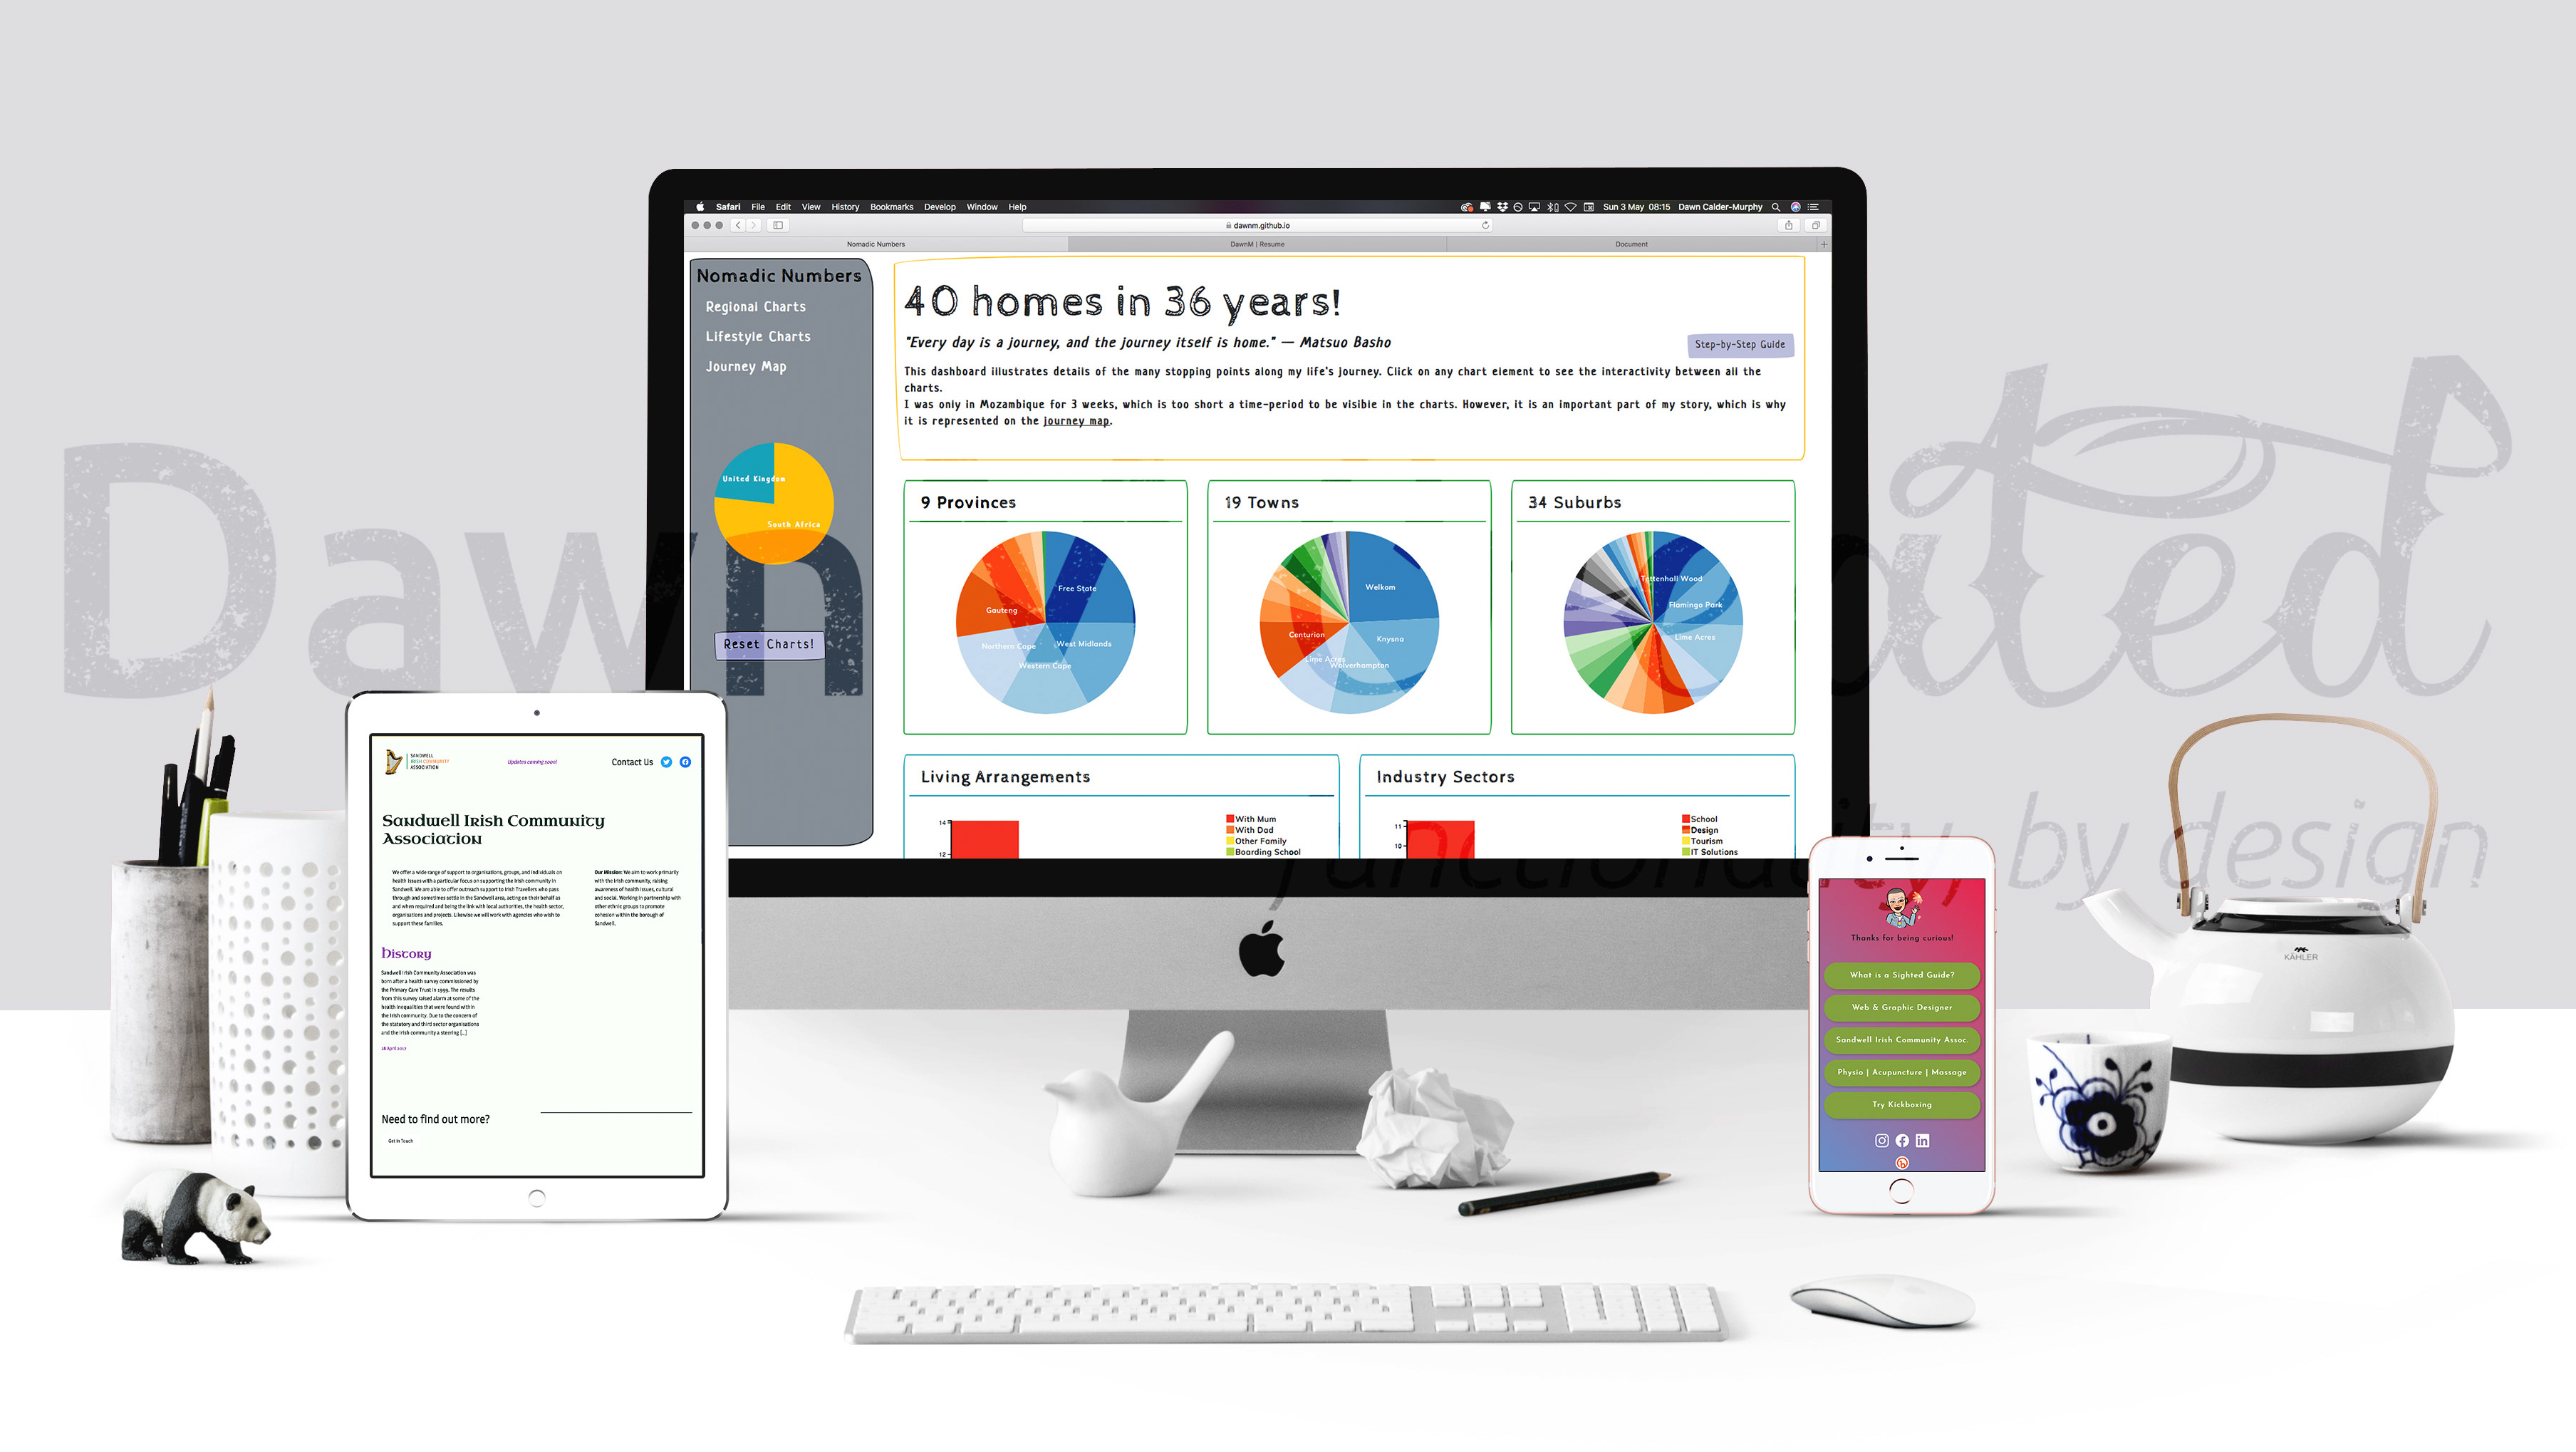
Data represented visually is a lot easier for us to take in. It also makes it easier to spot patterns and trends. Data visualisation can be used for reports, KPIs, survey results, and many other forms of data that need to be quickly understood.